Introduction
Client transaction data is arguably one of the most easily traceable types of data that anyone could find themselves working with. Curiosity could easily get the best of a data professional working on a project at an investment firm or bank, leading them to look up sensitive information about a friend or colleague – in clear breach of data privacy policies. It is for these very reasons that financial institutions are so hesitant to make large financial datasets available to inhouse data science teams and, even more so, to third party machine learning solutions companies. Aside from access to data being a problem, available datasets are oftentimes not labeled, leading teams to spend days or even weeks simply labelling datasets by hand – no wonder that data labelling tools like this one, designed by Superb AI, are becoming increasingly popular and profitable lately.
It is, of course, well known that models require large training datasets to increase accuracy. And due to being on the receiving end of both problems previously mentioned, we ventured into the world of synthetic data generation.
Challenges and Considerations
An immediate challenge with generating synthetic transaction data is the inherent complexities. Certain patterns are relatively easy to pick out, like salaries and rent mostly being paid during the last and first week of a month, but being able to emulate more complex patterns like grocery spending, entertainment spending or even client salary chances in our dataset is a far more complex matter. Generating transaction data is also challenging in the sense that we want to generate data on a per-client basis to make it as realistic as possible, so simply fitting statistical models to all available data might seem promising, but could lead to inconsistencies in the data generation process.
Another challenge, strangely enough, is the sophistication of current machine learning techniques. A neural network based model will very easily be able to pick out hand-coded patterns from a synthetic dataset because we can only hand-code so many statistical parameters into a synthetic data generating model. This immediately inspires one to start looking up more sophisticated generative models. In our research, we consider two such sophisticated generative methods, one based on the GPT-2 language generative model and another based on a generative adversarial network (GAN) architecture. We considered the GPT-2 based model, because the large model has over 1.5 billion parameters and according to research done at Cornell University text generated using the large GPT model produced human believable results, obtaining a ‘credibility score’ of 6.91 out of 10. When compared to the medium model’s (335 million Parameters) score of 6.07 this is a significant improvement but the computational time required also scales up significantly. We consider the GAN based architecture, because of their popularity and improvement over recent years as well as their power to generate usable datasets across multiple fields. For more on the development of GANs in recent years (particularly with respect to financial datasets), we suggest the following article.
Methodologies
The Googling
After some initial googling, one can find some powerful tools for generating synthetic data like Faker and Trumania. Faker, in particular, has the ability to, with relevant ease, generate client names, telephone numbers and addresses. In conjunction with some random number generation it is relatively easy to create a quick and very naive way of generating something that resembles a client banking statement. It, of course, lacks nearly all of the intricacies that such a dataset possesses and cannot replicate the interdependence of variables in the dataset.
The Naivety
The next logical step would be to investigate and try to simulate the distributions of dates, and transaction amounts. To this end, statistical distributions can be fit to date distributions, transaction amount distributions, and, given a certain timeframe, the probability of the occurence of certain transaction types can be deduced.
From this, one can design a script that determines probability weights for transaction dates and transaction amounts based on their occurrences in the real labelled dataset to be augmented and enlarged. This method has the shortcoming that it will only ever be as good as the amount of ‘parameters’ one can introduce by hand. The handwritten-algorithm generated datasets can seem realistic to the naked eye, but neural networks trained on such data will pick out patterns with relative ease due to the lack of complexity, as previously mentioned, and will most likely not fare well when applied to real data.
An interesting tool that was found during this phase of work was the python fitter package, which can fit the most optimal scipy statistical distribution to any list of numbers and return the optimal distribution name and parameters to sample synthetic data from.
Transaction amount data is also very positively skewed, which brings a challenge when trying to fit statistical distributions to it. To overcome the challenge of data skewness, a Box-Cox transform was applied to all transaction amounts in the original dataset. To generate a synthetic transaction amount, we first perform a Box-Cox transform on the original transaction amount data and store the Box-Cox transform parameter. We then apply the fitter method to the transformed data to obtain the optimal distribution name and the distribution parameters from which we then proceed to sample a random amount from, given the correct parameters, and finally perform an inverse Box-Cox transform to the amount using the saved Box-Cox parameter.
This seems like a tedious procedure but it has a few benefits in that distributions and Box-Cox parameters only have to be calculated once for all transaction categories, it generates data which very closely resembles the original transaction amount distributions and the Box-Cox transform ensures that generated data is always positive which avoids the issue of the model accidentally generating a negative transaction amount.
The greatest challenge of this method was generating realistic transaction references for each transaction. The crude way that this problem was addressed was to create a list of roughly 30 real transaction references for each transaction category. The model was then designed in such a way that it would create a vocabulary list of all words in the reference list for each category and, with a weighted probability, would choose to either pick one of the original 30 references as the reference for the transaction being currently generated or to synthesise a new reference by randomly sampling a certain amount of words from the vocabulary list. This amount of words was determined by sampling an integer amount from a normal distribution where the mean and standard deviation was calculated from the amount of words per reference in the original dataset.
A major benefit of this hand-coded method, in general, is that it is very quick to get it up and running (assuming that access to real data is available) and that it forces one to gain an underlying understanding about how distributions in the data are connected. For example, one learns that different types of transactions tend to happen around the same time of the month or what size of transaction amounts can be expected for certain transaction categories. This is also one of the method’s drawbacks though, as one not only needs a clear understanding of the nuances in the data before starting to perform statistical fits, one also needs to know exactly what output data should look like. A challenge that was encountered initially in this case, for example, was that data needs to be generated on a per client basis and not as one large batch to be sifted through later. Every unique transaction category also has its own date and amount distributions which really quickly becomes a lot of statistical fits. Our dataset only had roughly 40 transaction categories and, in the case of a dataset with much more categories, this will become extremely tedious. Another weakness, as mentioned, is that the synthetic data will only ever be as ‘good’ for training as the amount of statistical parameters that one is able to come up with.
Please see an example output for a given client below:
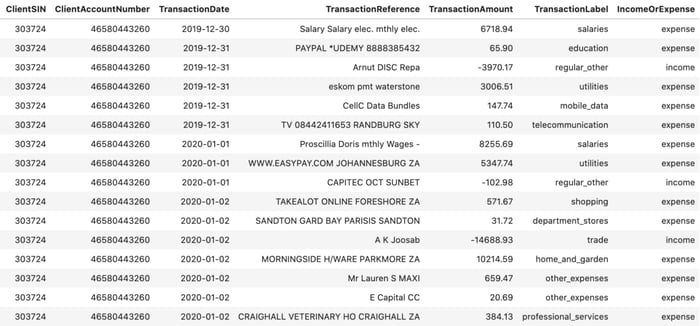
Figure 1: Synthetic client data generated using the original hand-coded model
It should be noted that the negative transaction amounts in Figure 1 are to imitate the way that financial institutions display data, where client income transactions are seen as credit type transactions while client expense transactions are seen as debit type transactions.
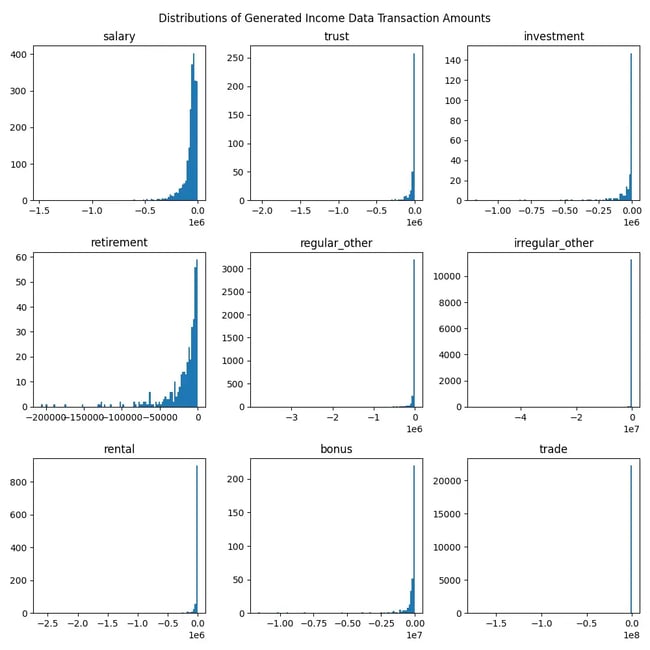
Figure 2: Transaction amount distributions for the generated income data. Again, note that income type transactions are given as negative in keeping with institutional convention.
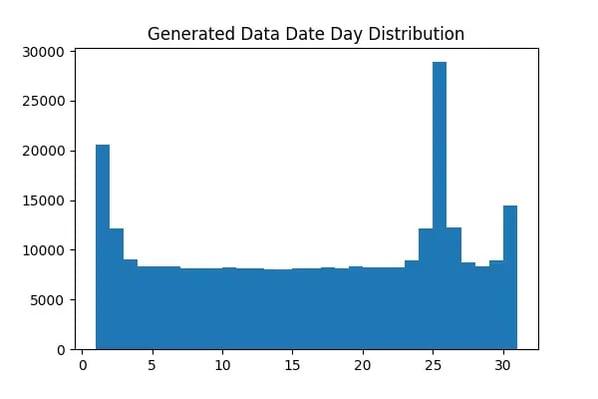
Figure 3: The distribution of the day values in every date of the generated dataset
At first glance the data in Figure 1 seems plausible, but upon further inspection we can easily spot the weakness of the model in generating believable transaction references. When considering Figures 2 & 3 though, we can note the model’s strength in producing accurate date and transaction amount distributions.
It should also be noted that for all further, more sophisticated, methodologies discussed in this blog the models were trained on this synthetic data shown in Figure 1 due to data privacy and access constraints. Therefore, in our case, having this toy synthetic dataset (although not as nuanced as the real data) proved to be immensely useful and definitely worth the time it took to initially build the model from scratch.
The Sophistication and Failure
An amazing and inspirational work titled ‘Tabular Transformers for Modeling Multivariate Time Series’, or ‘TabFormer’ for short, has been done by a joint research team from IBM and MIT. In their paper, they discuss a new model named TabGPT which leverages the power of HuggingFace transformers and the GPT-2 language generative model to produce a synthetic client credit card transaction dataset which was used downstream to train a fraud detection model. All datasets and code used in the paper are open sourced and can be accessed at the following github repository.
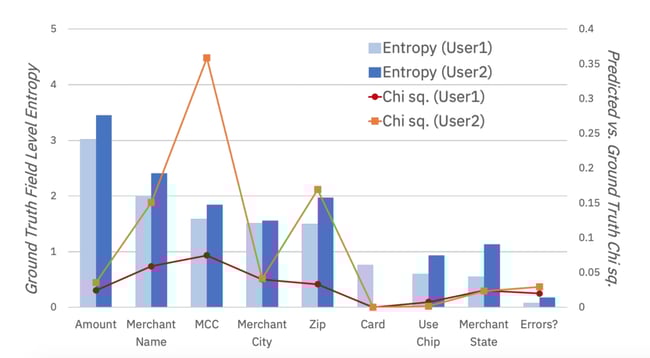
Figure 4: This figure illustrates how well the synthetic data compares to the ground truth data the model was trained on by using the Chi-square metric. The model was trained to synthesise data for two users for which a large amount of transaction data (roughly 60 000 transactions each) was available. One can see that the synthetic data fits the original data surprisingly well, even for data columns which have very high entropy, like Amount in this case.
In order to generate synthetic data, the transaction data of a given client is ordered chronologically and split into chunks of 10 transactions. Each chunk is fed into the model where the model learns to predict the following 9 transactions given the first one. It displays great power in this regard and the potential use cases for such a model are extremely exciting.
Initially it was thought that it would be a trivial task to adapt the code in order to produce a synthetic client banking transaction set, but it turned out to be a much greater challenge than expected and had to be aborted due to time constraints. We highly recommend investigating this method in the future and adapting it to your own synthetic data generation needs. Be advised that a good understanding of the HuggingFace transformers and a powerful machine will come in very handy!
Some Sophisticated Light in the Tunnel
The idea of using a sophisticated method such as GPT-2 to generate client transaction data seemed very interesting and became a plausible solution by adapting the method used by the TabFormer team. We adapted their method by reading in a dataset of client transactions in the form of a Pandas dataframe and used our own separator and delimiter tokens to convert a dataframe of transactions to one long string of text. Here we use the string ‘## ##’ as a separator token to denote the beginning and end of a particular transaction and use the string ‘;’ as a delimiter to denote the different columns in each transaction row.
As an example, see the training data string that was produced from the generated client data shown in Figure 1:

Figure 5: Processed data for retraining the GPT-2 model
This string was then encoded and given to the lightweight GPT-2 model with 117 million parameters for retraining. The retrained model is primitive in the sense that the data was not split into chunks of 10 like the TabFormer team, but nonetheless it will produce 19 new transactions given only one.
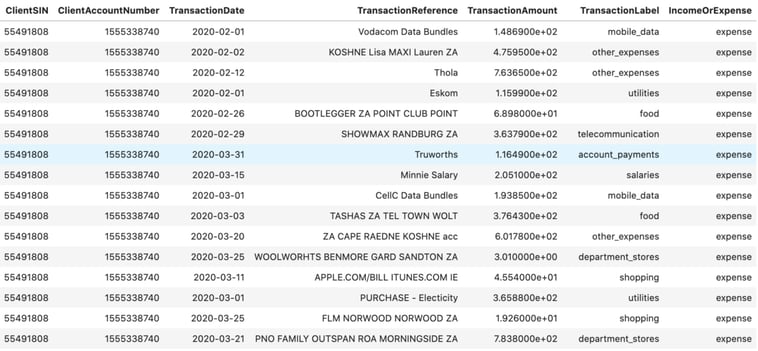
Figure 6: Data generated using our ‘simpler’ GPT-2 approach
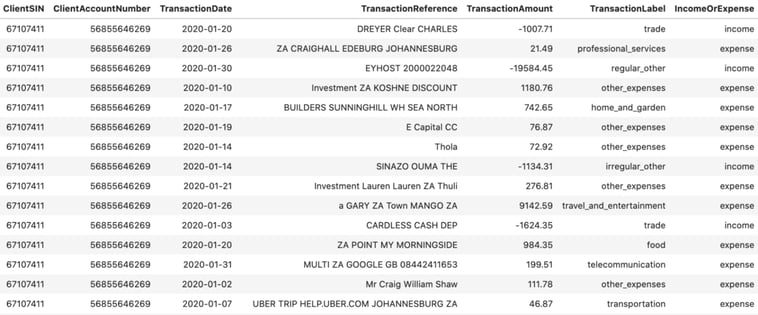
Figure 7: Data the ‘simpler’ GPT-2 model was trained on
The model had to be trained natively on a MacBook Pro and, due to the subsequent computational constraints, could only be trained for roughly 1900 steps – not even completing a full epoch. Nonetheless, when we compare the generated data in, Figure 6, to the data the model was trained on, in Figure 7, we can notice some impressive results! This model can pick up the nuance of income and expense transactions and (given the synthetic data it had to train on) produces reasonable looking transaction amounts, dates and references.
This is a very promising first step for generating synthetic transaction data using GPT-2 and can easily be expanded upon to be more realistic. A major challenge using these methods is that even the lightweight GPT-2 model is very computationally expensive and would need to be run on a more powerful machine than we had access to.
For further GPT-2 related data generation, we suggest taking a similar approach to the TabFormer team by segmenting data into chunks. We also suggest making every effort to train the model on real data and on a more powerful machine such that the model can complete training epochs and synthetic data can be compared to real data. It would be of particular interest to see how the model, trained on real data, would handle synthesising transaction references, which is something the TabFormer team did not fully attempt and could lead to cutting edge research findings.
The Sophisticated Jackpot
After running into computational bottlenecks, some further research was done which led to the discovery of The Synthetic Data Vault Project (SDV). This is an open source project run by the MIT Data to AI Lab that makes a wealth of packages, as well as their source code, available which can be used to both generate and evaluate synthetic data.
Stated in their own words, the ethos of the project is given as ‘… releasing several years of our work building, testing and evaluating algorithms and models geared towards synthetic data generation.’
SDV makes mention of three particular types of datasets for which it has produced models that can generate synthetic data, namely: single table, multi-table and time series data. Client transaction data falls into the single table data class and SDV makes a Gaussian Copula, Conditional Tabular GAN (CTGAN), Copula GAN and a Tabular Variational AutoEncoder model available for synthesising such tabular data.
Due to it being the most recent, we decided to further investigate the CTGAN model which is unique in that it employs a mode-specific normalization technique (designed by the SDV team) on continuous variables to prepare data for model training and introduces a conditional vector for data generation which deals with imbalances in categorical columns. The team found that categorical columns in tabular data have a tendency to be highly imbalanced with 90% of the data sometimes belonging to only one category. This is where the aforementioned conditional vector shines in overcoming this problem, ensuring that smaller categories are better represented in the generated data.
SDV models have the advantage that they are extremely straightforward to run out of the box and, due to code being open sourced, do not have to remain a blackbox for anyone willing to do a bit of investigation. One simply needs a pandas dataframe of real data and a list of categorical variables in the dataset to get things going. A major drawback, however, was that CTGAN is exceptionally resource hungry – making it impossible for us to ever train the model on more than a couple thousand transactions without crashing our machine. This led to generated data not looking very realistic when compared to the data the model was trained on.
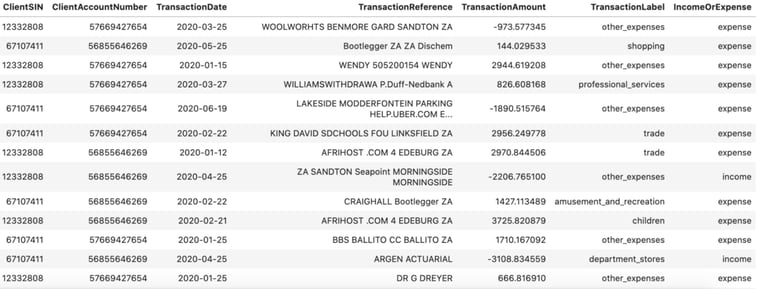
Figure 8: Synthetic data generated using CTGAN. This model was trained on 1200 transactions for 300 epochs. It should be noted here that the negative transaction amounts are a mistake. The training data contained only the absolute value of all amounts as the model did not work when fit on negative values.
SDV also makes a package available for evaluating the quality of the produced synthetic data called evaluate. It is really straightforward to use and produced the following results for our synthetic data:
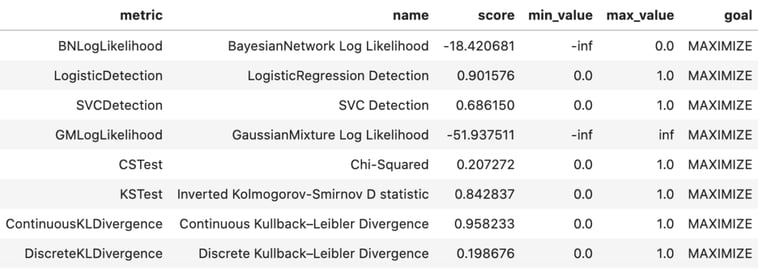
Figure 9: SDV evaluation metrics showing the goodness of fit for synthetic data to the ground truth data
From Figure 8 and the evaluation metrics in Figure 9, we can see that the data generated does not emulate the data it was trained on very well at all, but we do suggest investigating this method in the future with a more powerful machine which could train on a much larger dataset.
Some further thoughts
A ‘nested GAN’ if you wish (for the bold only)
A Generative adversarial network relies on two components, the generator and the discriminator – both of which are neural networks. The generator will strive to generate data from a vector of random noise, while the discriminator will compare the generated data to real data and determine whether the data looks authentic or not. In simple terms, the generator will get better at producing data that looks closer to the real data with every iteration in an attempt to ‘fool’ the discriminator until the discriminator can no longer tell the difference between what is real data and what is generated data. This is analogous to a banker who, having worked with many real banknotes in his life, is able to instantly tell whether a note they are handling is authentic or not – until they are fooled by a genius (and probably very rich) fraudster!
A suggested improvement to the aforementioned methodologies would be to pick one of the more sophisticated methods, let’s say CTGAN for argument’s sake, and train it on a subset of real labelled client transaction data. We then let the trained model produce a synthetic dataset, allow humans to evaluate the synthetic dataset and label the synthetic data as looking authentic or not. All data labelled as looking authentic by humans can then be added to the original training dataset, the model can be retrained to produce a new synthetic dataset and the process can be repeated for as many iterations as is necessary to produce the desired ‘realness’ in the synthetic data.
This is indeed an expensive process, both from a computational and physical ‘manhours’ point of view, but it could have the trade off that once a model is trained and saved it can produce very accurate synthetic data that can be used to train more accurate models in the future. An alternative would be to save trained models and only retrain the saved model on the authentic looking synthetic data after every iteration. Please see the following diagram:
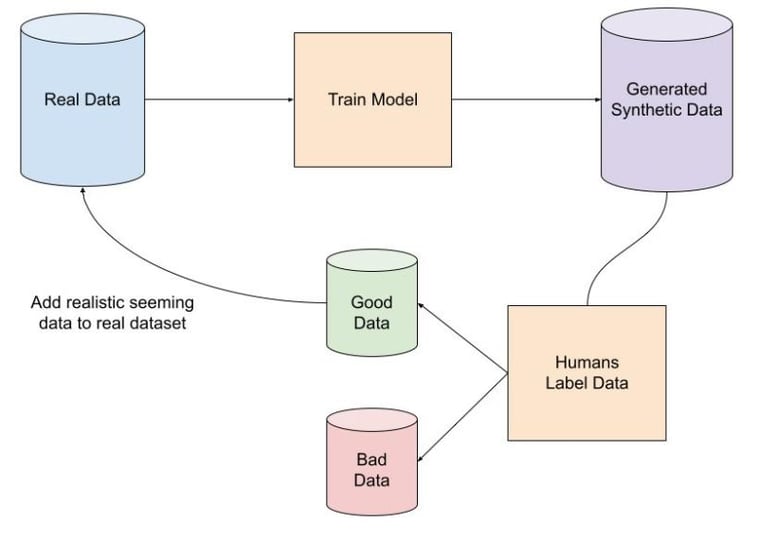
Figure 10: A proposed method for improving the quality of generated synthetic data
Conclusions
As illustrated, generating realistic synthetic transaction data is indeed a very challenging, yet exciting, task that researchers dedicate themselves to solely. We have briefly discussed some methods that can be used to generate synthetic data, but it is a field that is rapidly growing and upon a quick Google search one will easily be able to find dozens of papers on the topic. We chose the methods mentioned here because of their understandability, usability and because both methods are cutting edge in their own right. We can also conclude that, although being more challenging to get going, retraining a GPT-2 model on transaction data offers great promise for future work but that the user-friendliness of the models made available by SDV cannot be beaten – especially if proper computational resources are available.
Further Work
For further research, we would suggest starting with SDV as it is the easiest to get going. We also suggest making every effort to run SDV models on real data using more powerful machines – the possibility with these models is truly exciting! Where more time is available, adapting the TabFormer code to another use case seems like the option that could produce the most realistic results. The power of the evaluate package should also be leveraged in any project to investigate how realistic synthetic data is when compared to a ground truth dataset. The evaluate package is a reliable test as it includes multiple evaluation metrics as opposed to only using the Chi-squared goodness of fit test as used by the TabFormer team.
Once a suitably realistic synthetic dataset is generated, we suggest experimenting by training models on purely synthetic data to then be able to evaluate how a model trained purely on such data performs when applied to real data when compared to models trained on real data only. Another interesting comparison could be to test how accurate models are that were trained on a ‘hybrid’ dataset which contains both real and synthetic data. Due to privacy issues, we were unable to ever train a model on our synthetic and then apply it to a real dataset to measure its performance, this is something we certainly recommend for future work.

References
- Faker, https://faker.readthedocs.io/en/master/
- Trumania, https://github.com/RealImpactAnalytics/trumania
- Fitter, https://github.com/cokelaer/fitter
- TabFormer, https://github.com/IBM/TabFormer
- Inkit, P., etal. (2020) ‘Tabular Transformers For Modeling Multivariate Time Series’, eprint: https://arxiv.org/pdf/2011.01843.pdf
- Hugging Face, https://huggingface.co/
- The Synthetic Data Vault Project, https://sdv.dev/
- Conditional Tabular GAN, https://github.com/sdv-dev/CTGAN
- Xu, L., et al. (2019) ‘Modeling Tabular Data using Conditional GAN’, eprint: https://arxiv.org/pdf/1907.00503.pdf