
Self-service analytics is a form of BI (Business Intelligence) that enables you to answer your data-related queries and generate your own reports from your business’s data. This blog post aims to explain self-service analytics in terms of an example of an automated reporting system that Praelexis created for a client. This project included two workshops with this client where we provided nominal technical support and skill transfer for our client to be able to fully utilise self-service analytics for their data-driven business decisions. Once a client is introduced to self-service analytics, data analytics is democratised: The client has the ability to gain insights from their own data on their own.
Self-service Analytics in Action
“Having built systems that enable self-service analytics I’ve seen the worth — the way we do it I’ve seen the payoff.” — Caswell (Praelexis data engineer)
Praelexis was approached to create an automated reporting system. A handover workshop at the end of the development process is standard and essential practice. These workshops are used to explain to the client how they can use the product in a hands-on way. This specific client asked for an automated reporting system, but because of the additional benefits of the self-service analytics layer, the workshop also entailed showcasing these benefits. The aim of the automated reporting system was to answer predetermined questions regarding the operations of the business and generate reports. Because of the structured layer in the data pipelines, the client opted for a Microsoft Power BI interface. This enabled the client to answer additional questions, which the client did, in real time, in the meeting.
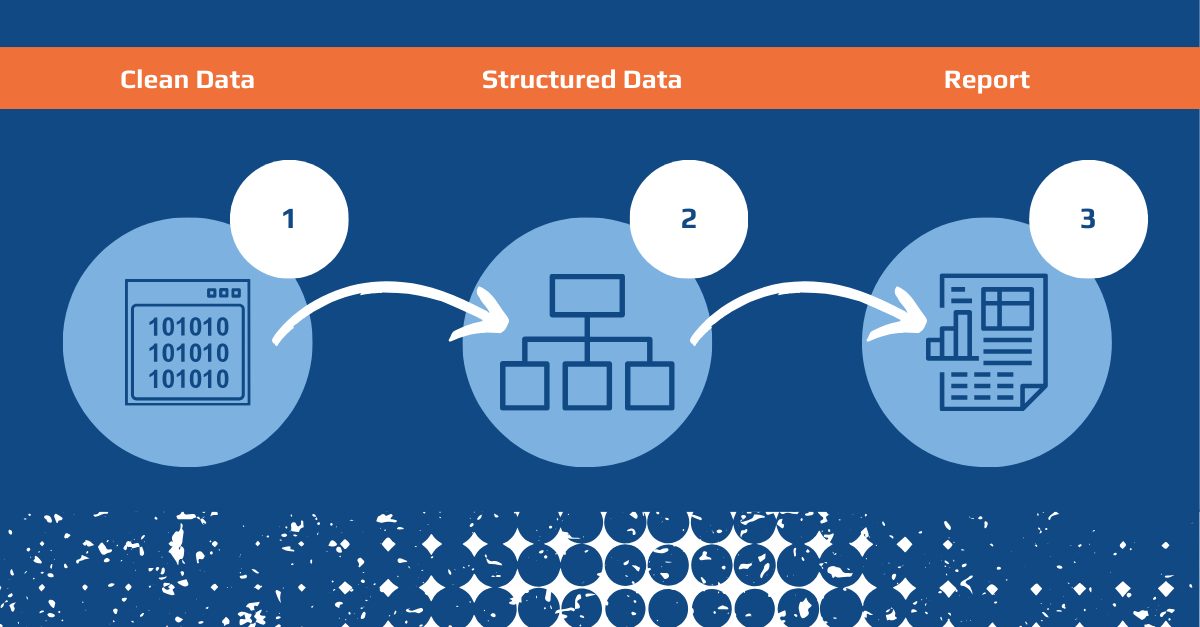
The initial project, creating an automated reporting solution, had three phases:
Step 1: Cleaning the data — This includes a clarifying discussion with the client regarding what the data entails.
Step 2: Structuring the data — Once we have a clear understanding of what the data is about, the data gets structured in a way that enables automated reporting.
Step 3: Reporting — The structured data is used to generate an automated report (that answers predetermined questions).
Figure 1: The three phases of an automated reporting solution.
Step 2: The potential of structured data
The first step of the automated reporting solution entails understanding the business data metrics. The data can be a combination of different types of information and it is important that the data engineers who are setting up the pipeline and the self-service analytics understand what the data is about. Once this is established the modelling of the data can commence. In this instance, modelling entails structuring the data in a way that makes automated reporting possible. An added benefit is the potential for self-service analytics.
Figure 2: Self-service Analytics
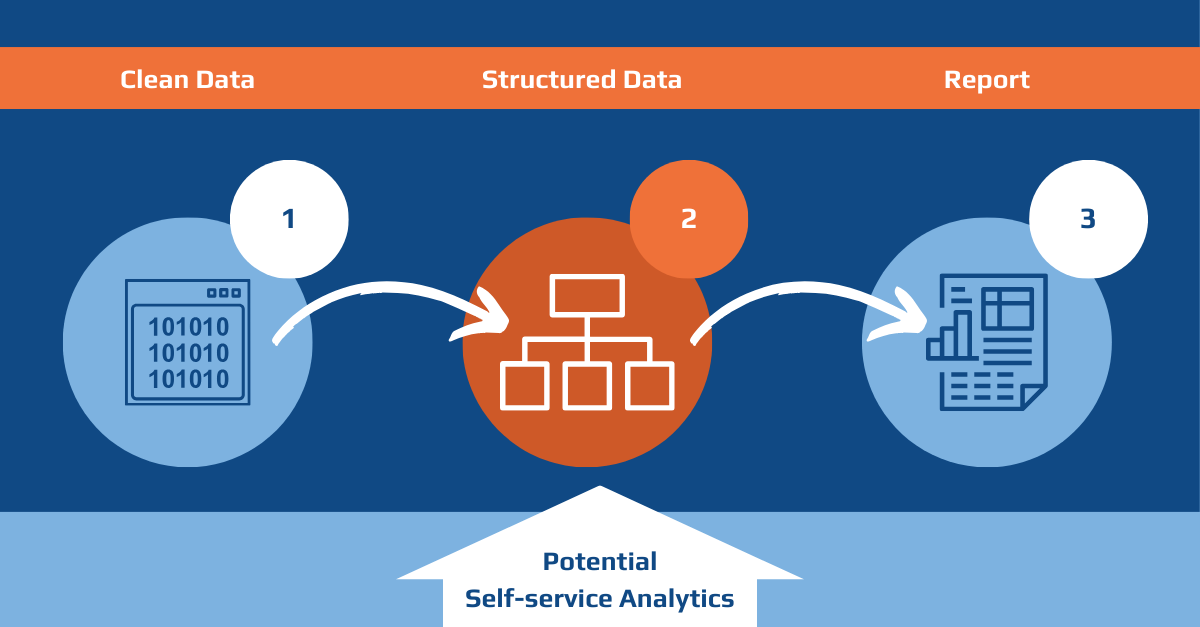
Together with Microsoft Power BI, structured data can be utilised for self-service analytics. This enables the user to “explore” the data, discover new insights and answer operational questions.
Why should your business implement self-service analytics?
Self-service analytics is a form of BI that enables you to extract insights from your data with nominal technical support. It is a reporting solution that simplifies the query process. Self-service analytics enables you to use your business data to make data-driven decisions. It is an added layer in a data pipeline that gives the users meaningful access to their own data. You can interact with a part of your data estate and because of that, the analysis of your data is being democratised. With self-service analytics, you can easily gain insights regarding trends, averages, cohorts, lists, aggregates, etc. Self-service analytics makes queries simple and you won’t need long lines of code to access the insights your data can provide you and your business.
What should you keep in mind when implementing self-service analytics?
“Not all self-service analytics are created equal.” — Caswell (Praelexis data engineer)
Self-service analytics isn’t a new concept. Sometimes it is even seen as a little bit controversial. It has gone in and out of fashion and that is because there are a few factors that need to be in place for it to be successfully and usefully implemented in a business. Here are some things to consider when starting your business’s self-service analytics journey:
Garbage in garbage out — For the user to be able to use Microsoft Power BI for self-service analytics, the data has to be structured. It is the responsibility of the data engineer to structure the data. However, both steps 2 and 3 will bring any data quality and integrity issues to light.
- It is a new tool — As with any new tools that you implement in your business, it might take some time to get used to and it might entail acquiring new skills. This is one of the ways in which our approach to self-service analytics is unique. We see the process of handing over the self-service analytics portal as a collaboration.
- Collaboration is important — There has to be a good working relationship between the potential data users and the data engineers setting up the self-service analytics. Dialogue regarding what the business data entails and a back and forth during the structuring process is vital.
- The success is determined by the approach — Our data engineers understand that it is important to clearly communicate how the data has been structured. Inherently, the structure has to make the query as simple as possible.
- Focus on in-house skills — The most important in-house skill you need is understanding the tool (in this instance Microsoft Power BI) in order to be able to transform your business data. Self-service analytics allows you to manipulate data in order to gain new insights about your business.
If all of these things are in place, the user will be able to gain insights based on their own curiosity and the exploration of your data.
The self-service analytics journey
We had a follow-up workshop with the client. This workshop was practical. It focused on how to use and implement self-service analytics, helping the users get to know the tool better. With the start of the whole process that led to an automated reporting system and self-service analytics, the client indicated what insights they needed to gain from their data. The workshop, therefore, focused on showing the client how self-service analytics empowers them, in a very practical way, to transform their own data to gain insights about their business. The client now has the potential to transform their own data, gain new insights and make data-driven decisions.
Figure 3: The ideal self-service analytics journey

This is how your business’s self-service analytics journey would ideally unfold:
- Understanding the data: Discussions with the data engineers regarding what the data entails.
- Structuring the data: The data engineers structure the data in a way that enables self-service analytics.
- Implementing the tools: Tools (like Microsoft Power BI) that enable self-service analytics are used to access the self-service potential of the structured data.
- Self-service analytics: Gain new insights through collaboration, utilising new tools, and acquiring skills.
In conclusion…
Self-service analytics democratises data analytics. This was illustrated to us when we created an automated reporting solution with a structured data layer that enabled self-service analytics. Through workshops, we explained the reporting solution and the self-service analytics portal to the client and saw the power of self-service analytics in person. Finally, there are a few things to consider when starting your self-service analytics journey and an ideal sequence of events to follow in setting up your analytics portal.
Praelexis AI are crafters of machine learning. Contact us, we would love to be part of your self-service analytics journey.

Written with: Aletta Simpson
Internal peer review: Johan van der Merwe
Illustrations: Generated by AI
Image layout: Aletta Simpson